Data Analytics & Visualization Services That Turn Data Into Decisions
Transform raw business data into real-time insights with interactive dashboards, machine learning predictive analytics, and Power BI Consulting Services. As a trusted data analytics consulting company, Seaflux delivers data analytics consulting services that streamline reporting, uncover growth opportunities, and drive faster, data-driven decisions.


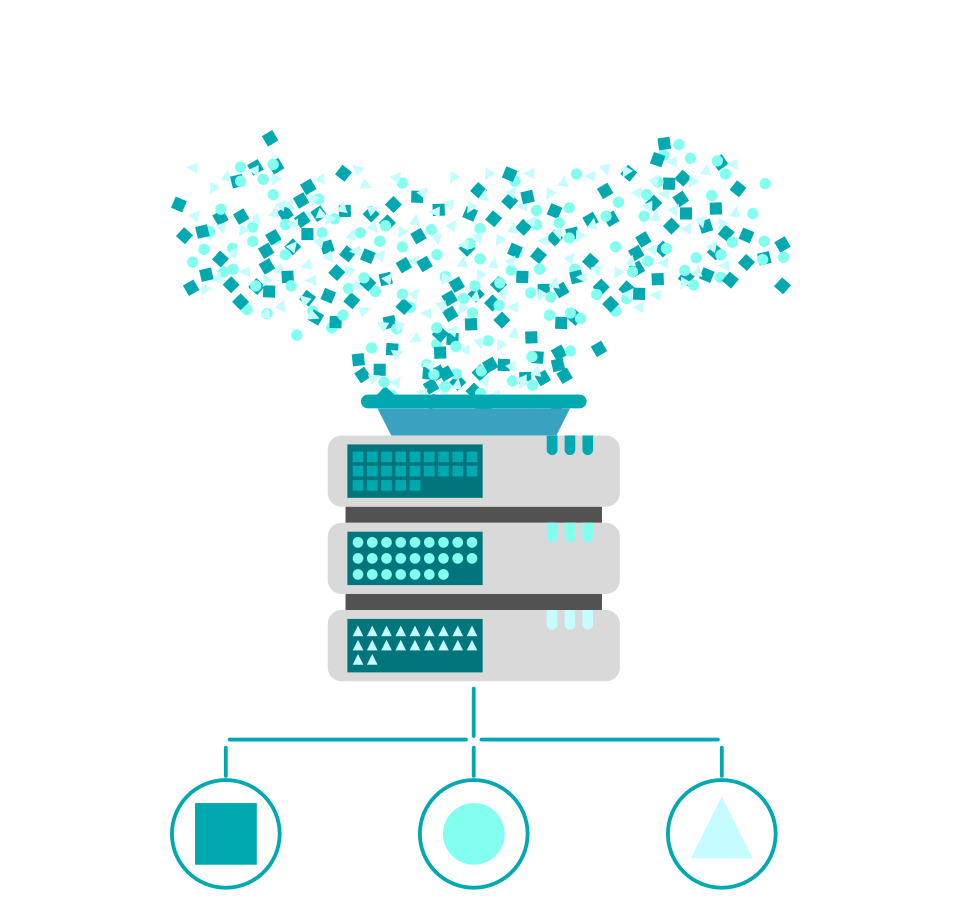
The modern data challanege
Every business collects data but only a few turn it into measurable impact.
Siloed data sources, delayed reporting, and inconsistent analytics pipelines reduce visibility, slow decision-making, and limit growth opportunities across the organization.
Without modern data analytics & visualization:

Decisions stay reactive instead of predictive

Teams struggle to connect KPIs with business performance

Valuable insights remain trapped in siloed data
Our Data Analytics Expertise
Seaflux helps organizations transform raw data into actionable intelligence through Business Intelligence Services and scalable data visualization. As a predictive analytics company, we combine data engineering, analytics strategy, and visualization expertise to deliver faster insights and measurable business outcomes.
We deliver:
End-to-End Analytics Infrastructure: From data ingestion and transformation to dashboards and reporting
Predictive Analytics & Forecasting: ML-powered forecasting, anomaly detection, and trend analysis
Interactive BI Dashboards: Real-time dashboard built for operational and executive visibility.
Data Governance & Security: Reliable, compliant, and enterprise-grade analytics ecosystems
Business Impact:
Faster Decision-Making: Real-time dashboards and automated reporting pipelines
Improved Forecast Accuracy: Predictive models that support smarter planning and demand forecasting
Optimized Analytics Costs: Scalable cloud analytics infrastructure that improves efficiency
Better Revenue Visibility: Data-driven insights that improve targeting, customer intelligence, and growth opportunities
Our Data Analytics and Visualization Services
- Analytics maturity assessment
- KPI framework & operating model
- PoC planning and ROI analysis
- Cloud data warehouse consulting and architecture
- Data pipeline development services for ETL/ELT
- DataOps orchestration with Airflow, DBT, and Kafka
- Executive and operational dashboards
- Embedded analytics experiences
- Guided drill-down reporting and visualization UX
- Predictive forecasting & trend analysis
- Anomaly detection & root cause analysis
- Recommendation and personalization engines
- Metadata management & data lineage
- Data quality monitoring & alerting
- Governance workflows and compliance controls
- Live KPI dashboards and alerts
- Streaming analytics and event processing
- Automated operational reporting workflows
Why Choose Seaflux for Data Analytics and Visualisation Services
We build analytics platforms, Data Visualization Services, and dashboards that convert signals into business actions, combining robust data engineering, machine learning, and productized visualizations. Whether you need an enterprise BI suite, a real-time operations dashboard, or predictive models that forecast demand, we deliver measurable outcomes.
Our Analytics Delivery Framework
From fragmented data to real-time business intelligence in four structured phases.
 Identify data sources, KPIs, reporting gaps, and operational bottlenecks.Architect scalable pipelines, semantic models, dashboards, and governance layers.Deploy analytics solutions, automate reporting workflows, and enable stakeholder adoption.Continuously improve performance through monitoring, predictive insights, and governance controls.
Our Engagement Models


Technology Stack


Our Clients
We understand that your success is our success, and that's why we are dedicated to providing you with top-quality service and software solutions.

Let’s Build Intelligent Insights Together
Turn your data into competitive advantage with our data analytics services. Whether you’re modernizing BI, automating insights, scaling your data platform, or choosing to outsource data analytics, we’ll design the right analytics roadmap for you.
Connect With Us
Frequently Asked Questions (FAQ): Get the Answers You Need
What analytics tools does Seaflux support?
We work with leading analytics and BI platforms including Power BI, Tableau, Looker, Grafana, and Apache Superset. Our team also supports modern cloud analytics stacks such as Snowflake, Databricks, BigQuery, Redshift, and Azure Synapse for scalable data analytics and visualization solutions.
How long does a typical analytics project take?
Project timelines depend on complexity, integrations, and reporting requirements. Most dashboard and data analytics implementations take 6 to 10 weeks, while enterprise data platform modernization and predictive analytics projects may extend to 12 to 16 weeks.
Can Seaflux integrate data from multiple systems?
Yes. We build secure data pipelines that integrate CRMs, ERPs, cloud applications, IoT systems, APIs, data warehouses, and third-party platforms into a unified analytics ecosystem for real-time reporting and decision-making.
How do you ensure data accuracy and security?
We implement enterprise-grade governance frameworks with data validation, lineage tracking, encryption, role-based access control, audit logging, and compliance standards aligned with GDPR, HIPAA, and ISO security best practices.
What industries benefit most from data analytics services?
Data analytics benefits any organization handling high-volume or fast-moving data. We commonly support logistics, fintech, healthcare, retail, SaaS, real estate, and manufacturing companies with predictive analytics, operational dashboards, and business intelligence solutions.
Do you offer Data Analytics Consulting Services?
Yes. Seaflux provides end-to-end data analytics consulting services including analytics strategy, KPI framework design, cloud data architecture, dashboard development, predictive analytics, and data visualization consulting tailored to your business goals.