A Guide to Monitoring Kubernetes with Prometheus and Grafana
Introduction
In today's dynamic and cloud-native landscape, monitoring and observability are essential aspects of managing and maintaining applications running on Kubernetes.
With the proliferation of microservices and containerized architectures, having comprehensive monitoring solutions becomes crucial for ensuring reliability, performance, and scalability in Prometheus for Kubernetes monitoring.
In this blog post, our goal is to enable users to set up a self-managed Prometheus instance using Helm in a Kubernetes environment. This setup aims to provide users with more control over their monitoring infrastructure, allowing for customization and flexibility in managing Prometheus and Grafana.
In achieving this goal, we will cover the following key aspects:
- Adding Prometheus Helm repository
- Installing Prometheus with Helm, tailored for self-management
- Configuring Grafana for efficient metrics collection and visualization
- Importing Grafana metrics for monitoring various services in your environment, creating a comprehensive Grafana dashboard
This guide is designed to be accessible for users with basic knowledge of Kubernetes and Helm, offering step-by-step instructions for a successful setup.
What is Prometheus for Kubernetes Monitoring?
Prometheus is an open-source monitoring and alerting toolkit originally built at SoundCloud. It is widely adopted for monitoring applications and services in modern cloud-native environments, specifically designed to monitor Kubernetes clusters. A self-managed Prometheus setup refers to an instance of Prometheus, that is configured and maintained by the user within their Kubernetes environment using Helm charts. Helm is a package manager for Kubernetes that simplifies the deployment and management of applications. It allows users to define, install, and upgrade complex Kubernetes applications using pre-configured package definitions called charts. Unlike managed services, a self-managed Prometheus instance provides users with more control over the configuration, customization, and maintenance of their monitoring infrastructure.
Key features and characteristics of a self-managed Prometheus:
- Control: Users have full control over the Prometheus configuration, allowing them to tailor it to their specific monitoring requirements.
- Flexibility: The ability to choose and modify components, such as alert managers and push gateways, provides flexibility in adapting Prometheus to unique use cases.
- Independence: Users can manage Prometheus independently, allowing for version upgrades, custom configurations, and integration with other tools.
- Customization: Fine-tune Prometheus to meet the specific needs of your microservices architecture, adapting to changing monitoring requirements.
By opting for a self-managed Prometheus setup, users gain the advantage of a highly customizable and scalable monitoring solution that aligns with their specific operational needs, integrating seamlessly with Grafana for comprehensive monitoring and visualization capabilities.
Prerequisites for Monitoring Kubernetes
Before you begin with the installation of a self-managed Prometheus setup, ensure that you have the following prerequisites in place:
- Kubernetes Cluster: Set up a working Kubernetes cluster. If you don't have one, follow the official Kubernetes documentation to create a cluster.
- Helm Installed: Helm is a package manager for Kubernetes that simplifies deploying applications. Make sure you have Helm installed on your local machine and configured to work with your Kubernetes cluster. Follow the Helm installation guide here.
- kubectl Installed: kubectl is the command-line tool for interacting with a Kubernetes cluster. Ensure that kubectl is installed and configured to communicate with your Kubernetes cluster. Instructions can be found here.
- Access to Grafana Dashboard: If you plan to use Grafana for visualization, ensure you have access to the Grafana dashboard. Follow the Grafana installation and setup instructions here.
- JSON Files for Import: Prepare the JSON files containing the Grafana dashboard configurations for the services you want to monitor. These files will be used during the import process.
Ensure that you meet these prerequisites to ensure a smooth installation and configuration process for your self-managed Prometheus setup.
Installation Steps for Prometheus and Grafana
1. Add Prometheus Helm Repo:
1 helm repo add prometheus-community <https://prometheus-community.github.io/helm-charts>
2. Install Prometheus with Helm:
1 helm install prometheus prometheus-community/prometheus \\
2 --namespace prometheus \\
3 --set alertmanager.enabled=false \\
4 --set prometheus-pushgateway.enabled=false \\
5 --set prometheus.configmapReload.prometheu.enabled=false
- The following file will be generated in the Prometheus.
figmapReload.prometheu.enabled=false
NAME: prometheus
LAST DEPLOYED: Mon Apr 15 12:05:12 2024
NAMESPACE: default
STATUS: deployed
REVISION: 1
TEST SUITE: None
NOTES:
The Prometheus server can be accessed via port 80 on the following DNS name from within your cluster:
prometheus-server.default.svc.cluster.local


Get the Prometheus server URL by running these commands in the same shell:
  export POD_NAME=$(kubectl get pods --namespace default -l "app.kubernetes.io/name=prometheus,app.kubernetes.io/instance=prometheus" -o jsonpath="{.items[0].metadata.name}")
  kubectl --namespace default port-forward $POD_NAME 9090


#################################################################################
######   WARNING: Pod Security Policy has been disabled by default since    #####
######            it deprecated after k8s 1.25+. use                        #####
######            (index .Values "prometheus-node-exporter" "rbac"          #####
###### .          "pspEnabled") with (index .Values                         #####
######            "prometheus-node-exporter" "rbac" "pspAnnotations")       #####
######            in case you still need it.                                #####
#################################################################################
3. Navigate to 'microservices-boilerplate' Directory:
1 cd infra/config-files/amp-files
4. Configure Grafana:
- Login to Grafana Dashboard.
- Go to DataSource, add a new Prometheus data source, add the Prometheus URL, and click on save and test
5. To set up Postgres as persistence for Grafana and add SMTP credentials to grafana.ini, follow these steps:
- First, create database on Postgres like “grafana-dev“ and “grafana-test“.
- Add the Database and SMTP details to the amp file.
- Set variables in your local PC as per the documentation 07-amp.md like this:
1 DOMAIN_NAME="test-yourproject.com"
2 COGNITO_AUTH_DOMAIN="https://microservices-test-yourproject-users.auth.eu-west-2.amazoncognito.com"
3 COGNITO_POOL_CLIENT_ID="your_id_here"
4 COGNITO_POOL_CLIENT_SECRET="your_secret_here"
5 GRAFANA_DB_URL="postgres://postgres:Qdfg5d4g54Yd5gQd4sfG@microservices-db.cluster-cm16afbs4pai.eu-west-2.rds
6 SMTP_PASSWORD="your_password_here"
7 GRAFANA_ENV="grafana-mb-test"
- Next, we need to copy the original amp file to a temporary file and run the "sed" command as follows:
1 cd config-files/amp-files
2 cp amp_query_override_values.yaml amp_query_override_values.tmp.yaml
3 sed -i "s/\[DOMAIN_NAME\]/$DOMAIN_NAME/g" amp_query_override_values.tmp.yaml
4 sed -i "s|\[COGNITO_AUTH_DOMAIN\]|$COGNITO_AUTH_DOMAIN|g" amp_query_override_values.tmp.yaml
5 sed -i "s|\[COGNITO_POOL_CLIENT_ID\]|$COGNITO_POOL_CLIENT_ID|g" amp_query_override_values.tmp.yaml
6 sed -i "s|\[COGNITO_POOL_CLIENT_SECRET\]|$COGNITO_POOL_CLIENT_SECRET|g" amp_query_override_values.tmp.yaml
7 sed -i "s|\[GRAFANA_DB_URL\]|$GRAFANA_DB_URL|g" amp_query_override_values.tmp.yaml
8 sed -i "s|\[SMTP_PASSWORD\]|$SMTP_PASSWORD|g" amp_query_override_values.tmp.yaml
9 sed -i "s|\[GRAFANA_ENV\]|$GRAFANA_ENV|g" amp_query_override_values.tmp.yaml
10 cd ../../
- Running the above command in Grafana, the following file is generated that resembles your setup is complete.
# serviceAccount:
#   name: "iamproxy-service-account"

grafana.ini:
  server:
    domain: grafana.test-yourproject.com
    root_url: https://grafana.your-amazing-project.com/
    router_logging: true
  auth:
    sigv4_auth_enabled: true
    login_cookie_name: grafana_session
    login_maximum_inactive_lifetime_duration: 12h
    login_maximum_lifetime_duration: 24h
    disable_login_form: true
    disable_signout_menu: false
    signout_redirect_url: https://microservices-dev.auth.eu-west-2.amazoncognito.com/logout?client_id=your_id_here&logout_uri=https://grafana.my-amazing-project.com/login
    oauth_auto_login: false
  aws:
    assume_role_enabled: true
  auth.generic_oauth:
    enabled: true
    name: OAuth
    allow_sign_up: true
    auto_login: false
    client_id: your_id_here
    client_secret: your_secret_here
    scopes: email aws.cognito.signin.user.admin openid profile
    auth_url: https://microservices-dev.auth.eu-west-2.amazoncognito.com/oauth2/authorize
    token_url: https://microservices-dev.auth.eu-west-2.amazoncognito.com/oauth2/token
    api_url: https://microservices-dev.auth.eu-west-2.amazoncognito.com/oauth2/userInfo
    role_attribute_path:
      (
        "cognito:groups" |
          contains([*], 'grafana-admin') && 'Admin' ||
          contains([*], 'grafana-editor') && 'Editor' ||
          contains([*], 'grafana-viewer') && 'Viewer'
      )
    role_attribute_strict: true
  security:
    cookie_samesite: lax
  database:
    url : postgres://postgres:sdfsdfsfsdf@sdfsdfsdf-db.cluster-sdfsdf.eu-west-2.rds.amazonaws.com:5432/grafana-dev
    ssl_mode: disable
  smtp:
    enabled: true
    host: email-smtp.eu-west-2.amazonaws.com:587
    startTLS_policy: MandatoryStartTLS
    password: sdfsdfsfs+pHt+s0
    user: fdsfsdsdfs
    from_address: contact@seaflux.com
    from_name: grafana-mb-dev
resources:
  limits:
    cpu: "500m"
    memory: "1G"
  requests:
    cpu: "85m"
    memory: "256Mi"

assertNoLeakedSecrets: false
- Make sure to keep assertNoLeakedSecrets flagged false, or it will show error.
- Now, we just need to apply the tmp.yaml file with the command provided below:
1 helm upgrade --install grafana-for-amp grafana/grafana -n default -f ./amp_query_override_values.tmp.yaml
- After applying this command, you will find the DATABASE and SMTP details in grafana.ini, and the following file is generated.
Release "grafana-for-amp" does not exist. Installing it now.
NAME: grafana-for-amp
LAST DEPLOYED: Mon Apr 15 12:00:54 2024
NAMESPACE: default
STATUS: deployed
REVISION: 1
NOTES:
1. Get your 'admin' user password by running:

   kubectl get secret --namespace default grafana-for-amp -o jsonpath="{.data.admin-password}" | base64 --decode ; echo


2. The Grafana server can be accessed via port 80 on the following DNS name from within your cluster:

   grafana-for-amp.default.svc.cluster.local

   Get the Grafana URL to visit by running these commands in the same shell:
     export POD_NAME=$(kubectl get pods --namespace default -l "app.kubernetes.io/name=grafana,app.kubernetes.io/instance=grafana-for-amp" -o jsonpath="{.items[0].metadata.name}")
     kubectl --namespace default port-forward $POD_NAME 3000

3. Login with the password from step 1 and the username: admin
#################################################################################
######   WARNING: Persistence is disabled!!! You will lose your data when   #####
######            the Grafana pod is terminated.                            #####
#################################################################################
6. How to Create Slack Channel and App for notification.
- First, create a Slack Channel.
- Go to Slack and click on your workspace name at the top.
- Then, navigate to 'Tools & settings' > 'Manage Apps'.
- You'll be redirected to the Slack app directory. Click on 'Build' from the top right corner.
- Click on 'Create New App' > Click on 'From Scratch'
- Provide an App Name and select your Workspace, then click 'Create App'.
- Now, click on your created app and navigate to 'Incoming Webhooks' from the left panel.
- Go to 'Webhook URLs for Your Workspace' and click on 'Add New Webhook to Workspace'.
- Select the Slack channel where you want to receive notifications.
- Click 'Allow', then copy the Webhook URL and paste it into Grafana Alert Settings.
7. How to Get Notification on Email and Slack channel:
- To receive notifications via email and Slack, follow these steps
- After logging in to Grafana, navigate to Home > Alerting > Contact Points > Click on Add Contact Point.
- Provide a Name for the Contact Point and select the Integration type, such as "Email".
- In the Addresses field, enter your email address to receive notifications.
- For Slack notifications, click on Add Contact Point Integration.
- Select ‘Slack' from the integration options and enter your Slack channel name in the Recipient field.
- Paste the Slack channel's Webhook URL.
- Click on Save Contact Point. By completing this step, you'll enable notifications via email and Slack, enriching your setup for kubernetes metrics on the Grafana dashboard.
8. Import Grafana Metrics:
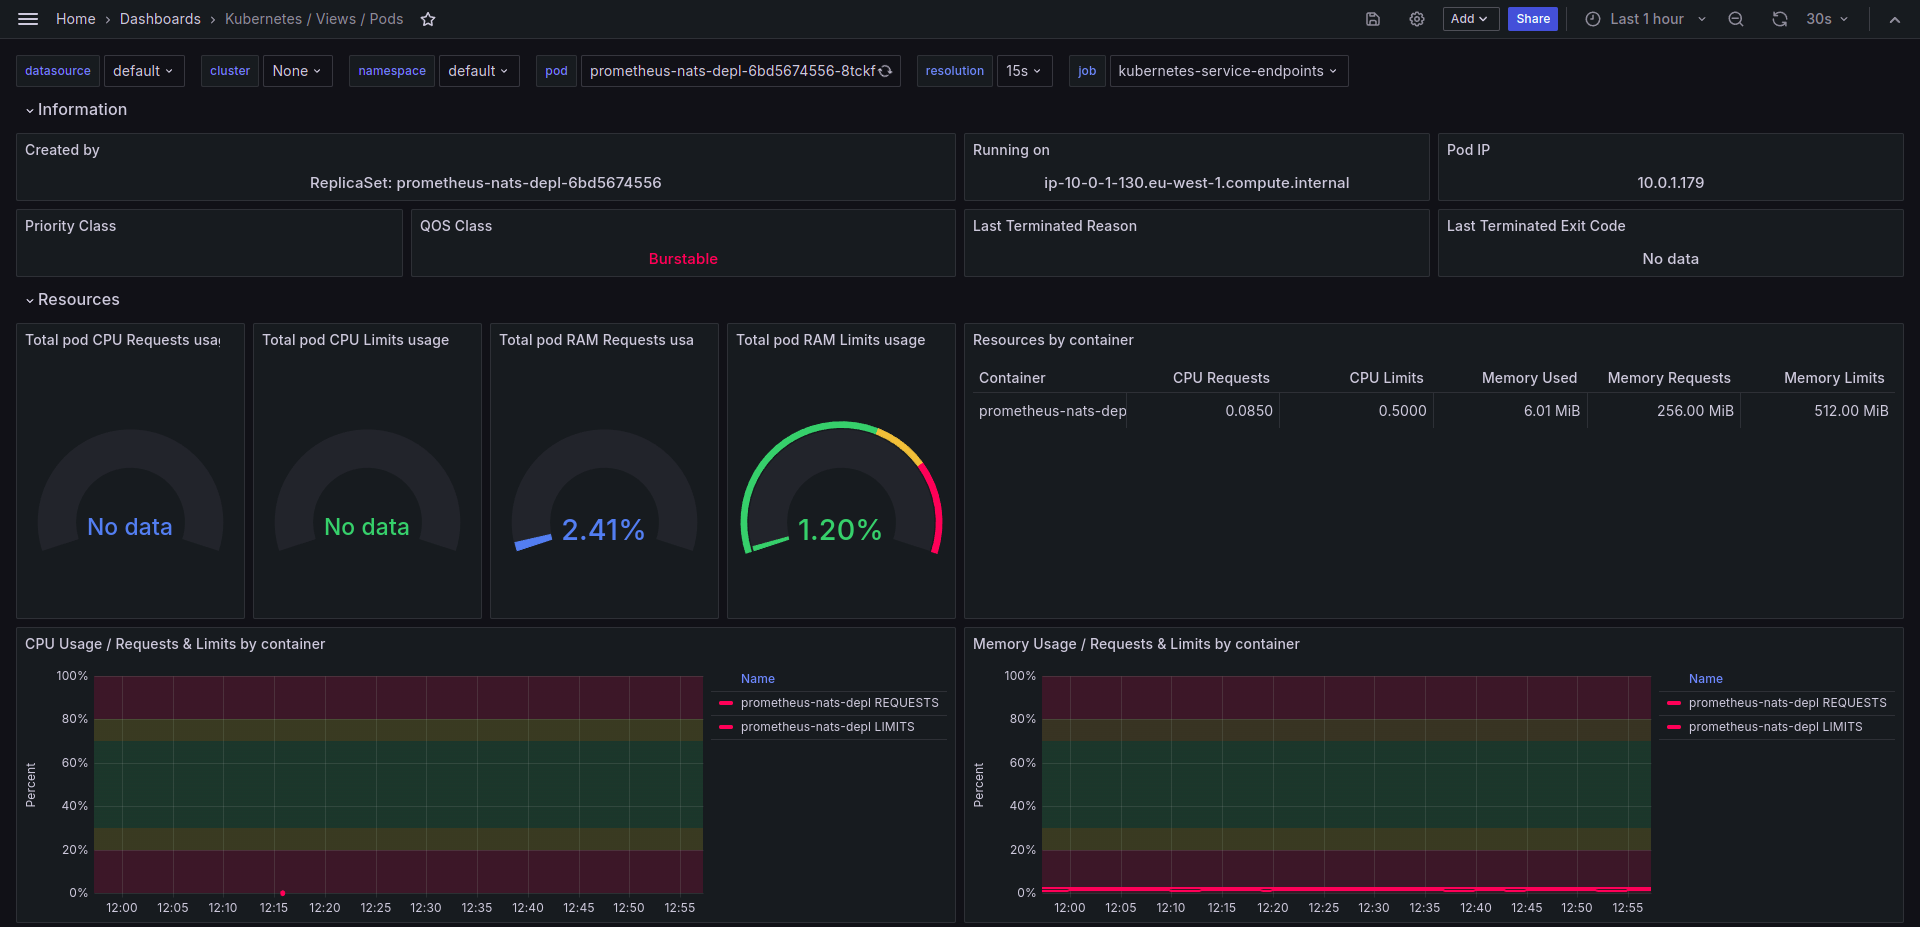
- After configuring the DataSource, go to the Dashboard, and click on Import.
- To import Grafana metrics for all services, go to microservices-boilerplate/infra/config-file/grafana-dashboard, copy the JSON file data, paste it into the import tab, click Save and Test. Repeat this process for all four provided metrics files.
JSON File for Import
Import the sample JSON file from this Github Repository by a Site Reliability Engineer to get the metrics on your Grafana Dashboard. You can edit your metrics according to your specific data.
Clean Up Process
If you want to remove the self-managed Prometheus setup and associated components, follow these steps:
1. Delete Prometheus Deployment:
Use the following Helm command to delete the Prometheus deployment:
1 helm delete prometheus -n prometheus
2. Delete Prometheus Namespace (Optional):
If you created a separate namespace for Prometheus, you can delete the namespace:
1 kubectl delete namespace prometheus
3. Verify Cleanup::
Ensure that all associated resources, such as Pods, Services, and ConfigMaps, are removed. Use kubectl commands to verify the cleanup.
1 kubectl get pods,svc,configmap -n prometheus
End Note
Congratulations! Now you know what Prometheus is and how it can be leveraged to monitor your Kubernetes microservices. By understanding and implementing it with Helm, you can effectively self-manage your applications with Kubernetes. Keep exploring and experimenting with different deployment strategies to optimize your deployments further.
We at Seaflux are your dedicated partners in the ever-evolving landscape of Cloud Computing. Whether you're contemplating a seamless cloud migration, exploring the possibilities of Kubernetes deployment, or harnessing the power of AWS serverless architecture, Seaflux is here to lead the way.
Have specific questions or ambitious projects in mind? Let's discuss! Schedule a meeting with us here, and let Seaflux be your trusted companion in unlocking the potential of cloud innovation. Your journey to a more agile and scalable future starts with us.

Himanshu Dudhatra
Senior DevOps Engineer